National Affordable Housing Report
Market Insights from Paul Fiorilla and Jacob Gonzalez at Yardi Matrix

2025 Policy Changes Boost Affordable Housing
Federal policy changes enacted in 2025 have positioned geographically targeted federal tax incentives at the center of the nation’s affordable housing strategy. These measures include a long-term extension of the Opportunity Zones (OZ) program 1, a 12% expansion of Low-Income Housing Tax Credit (LIHTC) allocations, improvements in private activity bond access for rehabilitation programs, and broader eligibility for the 30% basis boost in Difficult Development Areas (DDAs).2 While distinct in structure, all aim to improve project feasibility in underserved or high-cost environments. Together, these actions signal a policy landscape increasingly oriented toward location-based tax incentives that align capital with affordability needs.
The long-term effect depends on interest rate conditions, capital availability, construction labor constraints and local entitlement environments3. Even so, the combined weight of federal and state support positions the multifamily sector for a decade of elevated activity. The LIHTC program, responsible for more than 3.5 million affordable units since 1986, is projected by Yardi Matrix to deliver nearly 215,000 units in the next three years. With additional credits, that number could push higher. At the same time, Opportunity Zones have proven effective at attracting private capital into designated low-income submarkets. Approximately 600,000 multifamily units have been completed in OZs since 2017, establishing the program as a consistent facilitator of institutional investment.
Geographically targeted incentives influence not only whether projects pencil but where capital concentrates. More than 58,000 affordable units are under construction and another 178,000 are in planned or prospective stages within DDAs and OZs in the top 30 metros alone. These figures highlight how incentives are reshaping supply pipelines at a time when longstanding affordability gaps require sustained production.
- Nationally, there are 6.4 million units in OZs and DDAs, including 4.1 million units in DDAs and 2.3 million in OZs. Of the total, 5.1 million units are market rate and 1.3 million are fully affordable.
- The potential for growth is high. In OZs and DDAs, more than 205,000 units are under construction, and more than 143,000 units are in the planned stage, which we define as formal conceptual plans that are approved by a planning/zoning authority. Planned projects are expected to start construction within 12–18 months.
- The 348,000 combined units under construction or in the planned stage in OZs and DDAs represent 5.4% of total in-place stock. Of that, units currently under construction alone would increase stock by 3.9% in OZs and 2.8% in DDAs.
- OZ and DDA incentives could boost affordable stock more than market-rate stock. The number of units in the pipeline represents a 12.7% increase in fully affordable units and 3.5% increase in market-rate units in those areas.
- The DDA incentives make the development of affordable housing more feasible. The number of fully affordable units under construction would add 6.9% to stock in DDAs and 5.5% in OZs. The percentage of market-rate units under construction is less: 2.2% in DDAs and 3.1% in OZs.
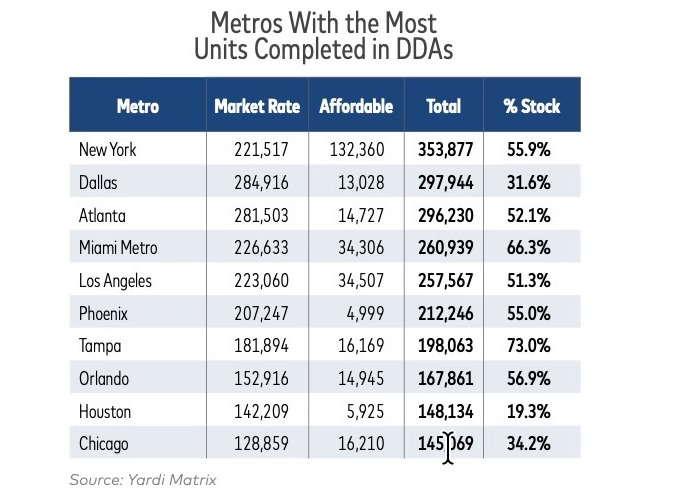
DDAs Anchor the Affordable Pipeline
The 1986 legislation that established the LIHTC program designated DDAs, areas with high land, construction and utility costs relative to the area median income. The DDAs enable developers to claim additional tax credits when they are calculating LIHTC equity, allowing projects to raise substantially more capital without increasing rents or tenant income limits.
LIHTC developments located in DDAs may be eligible for up to a 30% basis boost. This additional basis enables developers to raise more LIHTC equity, improving project feasibility in locations where affordable housing production would otherwise be financially challenging. In practical terms, the additional equity reduces the amount of debt needed to support construction. The effect is to facilitate new affordable housing development where land, materials and operating costs would otherwise preclude construction. In high-cost metros, the DDA incentive can help affordable projects move forward as opposed to remaining undeveloped. As a result, DDAs are a well-established driver of affordable production in cost-constrained markets.
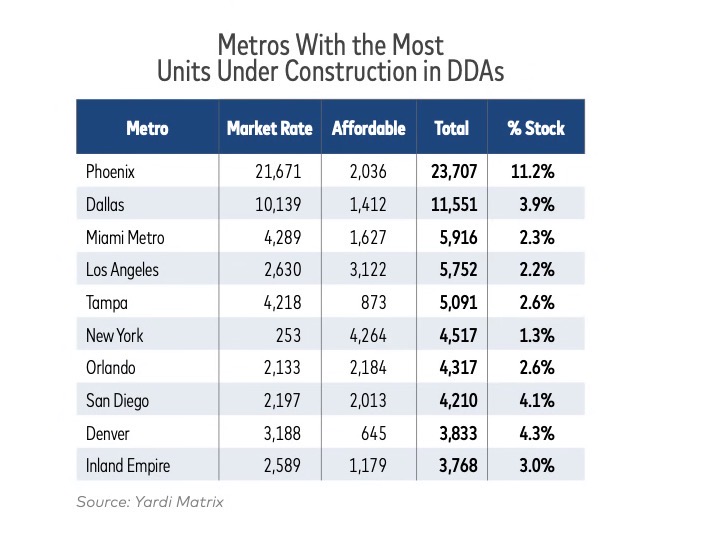
There are six metros with more than 2,000 fully affordable units under construction in DDAs: New York (4,264), Los Angeles (3,122), Seattle (2,377), Orlando (2,184), Phoenix (2,036) and San Diego (2,013). DDAs support fully affordable development in high-cost primary markets where elevated construction costs would otherwise constrain feasibility. In Los Angeles, fully affordable units under construction in DDAs would add 9.1% to stock. The forward pipeline is substantially larger, totaling more than 19,000 units (56.0%).
Metros with the greatest amount of total stock under construction in DDAs include Phoenix (23,707), Dallas (11,551), Miami (5,916), Los Angeles (5,752) and Tampa (5,091). In fast-growing Sun Belt metros, DDA development is driven by rapid population growth and rising construction costs that have narrowed margins for affordable development. In Phoenix, for example, 2,036 affordable units are under construction in DDAs, which would boost fully affordable stock in those areas by 40.7%. Counting developments in the planning stage, the DDA affordable development pipeline in Phoenix is 90% of current stock.
Sacramento reflects a comparable dependence on DDA incentives, though shaped by regional spillover rather than internal growth alone. Nearly 2,000 fully affordable units are under construction in DDAs, accounting for 19.0% of the 10,240 completed units. Another 3,600 units, or 35% of total stock, are in the forward pipeline in DDAs. Rising land values, entitlement constraints and continued displacement pressure from the Bay Area have elevated the importance of DDAs in Sacramento.
In coastal markets where rents have risen sharply in recent years due to rapid migration, the DDA relationship becomes even more pronounced. Along the Southwest Florida Coast, DDA tracts contain 424 affordable units under construction, equal to 18.0% of the 2,359 completed units. The fully affordable forward pipeline exceeds the size of the current affordable DDA inventory. This reflects escalating housing costs, which position DDA eligibility as a primary channel for scaling affordable supply alongside population growth.
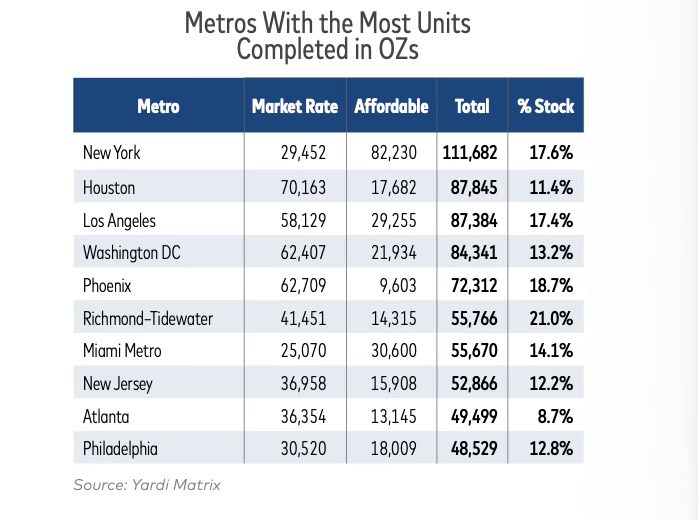
Opportunity Zones a Boost to Potential Development
While DDAs restore feasibility in cost-constrained environments, Opportunity Zones amplify development in low-income submarkets. Together, the two designations define complementary paths through which affordable housing enters the pipeline. The OZ tax incentives apply across multiple asset classes, but multifamily has emerged as one of the most common uses of OZ capital.
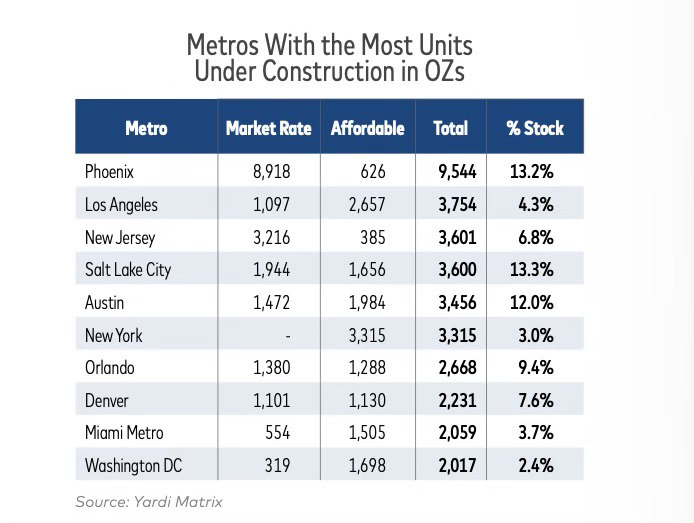
Salt Lake City provides the clearest illustration of OZ-driven acceleration. OZ tracts in the metro contain 1,656 fully affordable units under construction, equal to 27.2% of the 6,089 completed units. The forward pipeline remains deep, with 2,700 units in the planned or prospective stage. Austin follows a similar trajectory. The metro’s OZ tracts contain 1,984 fully affordable units under construction, representing 21.1% of the 9,411 completed units. The planned and prospective pipeline totals over 2,700 units, nearly 30% of stock. Zoning reforms, suburban expansion and sustained population inflow have created an environment where OZ incentives magnify a robust construction cycle in Austin.
Smaller but fast-growing metros reinforce this pattern. In Columbus, OZ tracts contain 847 fully affordable units under construction, equal to 16.0% of completed affordable stock, with an- other 20% in the pipeline. Raleigh–Durham has 389 fully affordable units under construction (12.7%), with another 40% in the pipeline. Although these markets operate on a smaller scale, their pipelines demonstrate how OZ incentives reinforce development in regions benefiting from institutional investment, employment growth and favorable demographic trends.
Incentives Key in Affordable Multifamily
The shortage of attainable rental housing continues to intensify across the United States, driven by a combination of high construction costs, persistent demand growth and regulatory barriers that limit supply. To address these challenges, federal policymakers have implemented geographically targeted incentives that are intended to redistribute investment toward locations where development has historically been difficult to achieve.
The pipeline patterns across DDAs and OZs high- light a clear division of labor within federal development policy. DDAs enable feasibility in markets where high costs suppress affordability-oriented construction, while OZs direct capital toward neighborhoods that are already experiencing or positioned for growth.
For developers, this distinction is increasingly determinative of where affordable projects can be underwritten with confidence. In metros such as Phoenix, Sacramento and the Southwest Florida Coast, without the DDA incentive many projects would struggle to pencil amid rising land values, construction costs and debt constraints. DDAs reduce downside risk by allowing for more tax credits to be claimed, which helps projects to proceed when they would otherwise stall.
Opportunity Zones accelerate multifamily development through tax incentives, concentrating capital into specific areas to boost production. For developers, OZs can shorten timelines and expand the universe of viable sites within high-growth districts. For investors, elevated construction intensity within OZ tracts signals where tax-advantaged capital is reinforcing demographic and employment trends rather than counteracting cost pressures.
Taken together, DDAs and OZs increasingly function as complementary tools rather than competing programs. DDAs define where affordable development is possible in cost-constrained markets, while OZs influence where capital moves fastest in growth-driven environments. For market participants, understanding this division of labor is critical. The most resilient affordable pipelines are emerging where incentives are aligned with local conditions, reducing risk and improving capital efficiency.
Due to elevated construction costs and capital constraints, geographically targeted federal incentive programs will play a larger role in shaping investment and development strategies.
The question for investors and developers is which incentive structure best aligns with a market’s underlying cost, demand and capital dynamics. Those who calibrate site selection, underwriting and capital deployment accordingly will be best positioned to capture the next wave of affordable housing production.
Paul Fiorilla is the Director of Research for Yardi Matrix and a frequent contributor to the Affordable Housing Newsletter.
His co-author, Jacob Gonzalez, is a Senior Analyst at Yardi Matrix, a comprehensive commercial real estate data and research platform that provides detailed property-level information, market analysis, and ownership data across various real estate sectors, including multifamily housing, office, industrial, retail, and self-storage properties.
For more great research and market insights, check out the Yardi Matrix website.
Opportunity Zones are geographic areas in the United States that have been identified as economically distressed or underinvested. They were created by the federal government through the Tax Cuts and Jobs Act of 2017 as a tool to encourage private investment in these communities. The program covers thousands of low-income neighborhoods across all 50 states, Washington D.C., and U.S. territories. ↩
A Difficult to Develop Area (DDA) is a geographic area that the U.S. Department of Housing and Urban Development (HUD) has officially identified as having higher-than-usual costs for land, construction, and utilities relative to local incomes. The designation is used in federal affordable housing policy, especially within the Low-Income Housing Tax Credit (LIHTC) program to support the construction of affordable housing in areas where the cost of development makes it harder to provide housing that residents can afford. ↩
For more information on these issues, check out previous issues of The Affordable Housing Handbook here and here. ↩


Comments ()